Texas Border Economy
Joshua Roberson and Rajendra Patidar (Mar 24, 2023)


Economic indicators along the border showed mixed responses for January. Payrolls expanded in all border Metropolitan Statistical Areas (MSAs), corroborated by decreases in unemployment rates and unemployment claims. International trade across the border increased and reduced the trade deficit. Commercial real estate activity is growing, and there is consistent growth in residential construction as well.
Demand for homes fell while more construction permits were issued in January. Falling housing demand has increased inventory and days to sale after listing, and it has reduced the median prices. Inflation was higher than expected, which could impact consumer earnings.
Economy
The Dallas Fed’s Business-Cycle Indexes indicated a slight deceleration in growth. At the metro level, El Paso reported a seasonally adjusted annualized growth rate of 5.4 percent, while slowdown in McAllen and Brownsville-Harlingen led to trivial growth. Meanwhile, the metric shrank by 7.2 percent in Laredo. Both pedestrian and personal vehicle crossings at the border were down by 9 percent and 3.4 percent in January. Border crossings were up from a year ago.
Overall, border nonfarm employment added 1,700 positions due to a hiring expansion in McAllen-Edinburg (Table 1). Sectors like trade, transportation, manufacturing, and hospitality were major contributors to employment growth in the border region.

The spike in jobs led to the lowest unemployment numbers since the onset of COVID-19. The border region’s unemployment rate fell to 5.4 percent in January. Joblessness in Laredo and El Paso were both less than 5 percent, while McAllen and Brownsville fell to 6.8 and 5.9 percent, respectively. The labor force participation rate ticked down statewide, while weekly unemployment claims declined across border areas.
Fluctuations in average private hourly earnings led toan increase in earnings. Consequently, inflationary pressures prevented meaningful gains in purchasing power. Nominal wages across the border grew to $20.82, while they stabilized at $18.22 in Brownsville. Hourly wages in El Paso and Laredo were at all-time highs at $23 and $20.88, while the metric averaged around $19 in McAllen-Edinburg-Mission and Laredo. Nominal wages across the border grew significantly in the first half of 2022 and surpassed pre-pandemic levels.
On the southern side of the border, Mexican manufacturing and maquiladora employment1 continued plummeting and reported a steep fall in December with 11,400 job losses. The decrease in Mexican manufacturing employment was driven by layoffs in Reynosa and Juarez (Table 2).

Global supply chain pressures decreased moderately in January, disrupting the upward trend seen over the previous two months as indicated by the Global Supply Chain Pressure Index (GSCPI). GSCPI’s recent movements suggest developments in Asia are slowing the index’s return to normal historical levels. Supply chain pressures were significantly down from a year ago and are expected to decline further.
The S&P Global Mexico Manufacturing PMI for January indicated worsening conditions in Mexican manufacturing as firms scale down production amid contraction in demand for goods.
In the currency market, the peso per dollar exchange rate averaged $18.972. After adjusting for inflation, the metric decreased over the month, revealing gains for Mexican importers. Total border trade values increased along with the reduction in the trade deficit. At the metropolitan level, El Paso’s and Brownsville’s exports expanded, resulting in positive net trade. Meanwhile, growth in exports at Laredo and McAllen reduced the trade deficit. In a broader context, the decline in real effective exchange rate (REER) for the second consecutive month reveals the softening of the U.S. dollar relative to its 2022 peaks.
Real Estate
Overall construction activity went up due to a rise in commercial and residential construction values. Changes in residential and nonresidential construction values varied across border areas. Construction of retail, offices, and schools boosted construction values by 48 percent in Laredo and 115 percent in McAllen year over year (YOY). Meanwhile, there was a slowdown in commercial construction in Brownsville and El Paso. Residential construction values have grown significantly along with new permits over the last few months. The metric went up by 76 percent in Brownsville-Harlingen and 16.7 percent in El Paso.
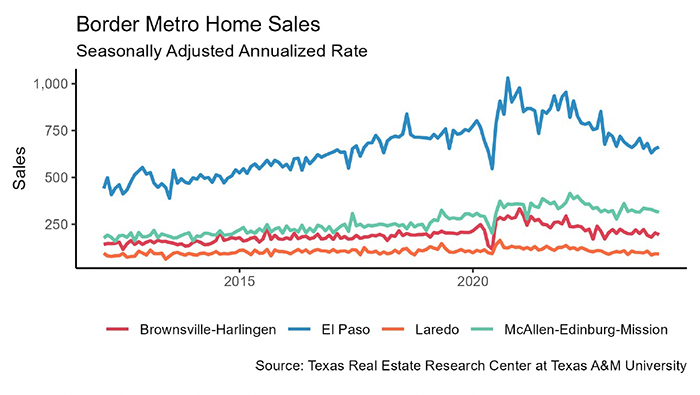
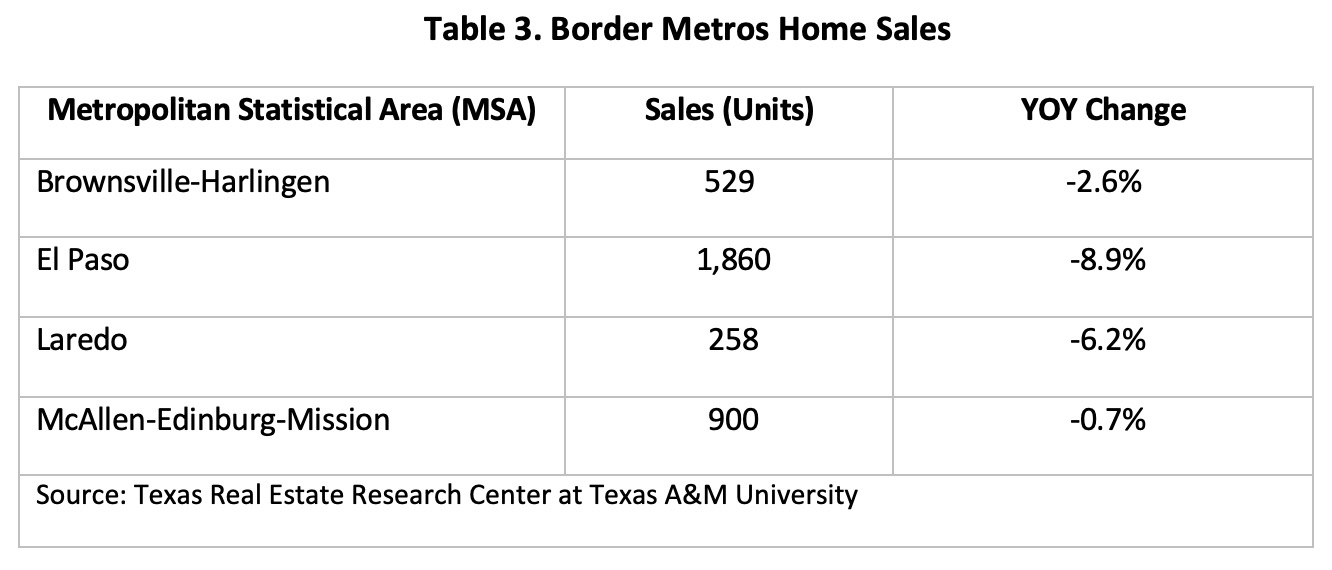
January’s housing market showed no signs of cooling as housing sales dropped by 9.4 percent month over month (MOM) after seasonal adjustments. There has been a steep fall in home sales over the last two quarters in McAllen-Edinburg-Mission and El Paso (Table 3).
Housing sales rely heavily on mortgage rates, and Freddie Mac’s 30-year fixed rate was 6.5 percent in January. Consumer buying behavior has changed in the last few months with concerns about rising mortgage rates and high inflation.
Border metros reported a rise in single-family housing construction permits in January after a continued reduction in new projects. A total of 600 permits were issued in all border metros, with McAllen-Edinburgh leading. Fewer permits were issued in 2022 than in the previous year as all major metros except McAllen reported declines. Despite declines in permit counts and values, the average value per permit remains elevated compared with pre-pandemic conditions.
Volatility in housing markets led to a rise in months of inventory (MOI) along the border, though the metric remained much lower than the typical six-month MOI benchmark. Laredo’s declining sales activity and an uptick in new listings pushed the average MOI for January to 3.2 months. El Paso’s metric was more than two months, while Brownsville’s metric averaged around four months. McAllen metro has the border region’s highest months of available inventory, at 4.2 months. These increases indicate inventory is growing primarily due to a decrease in home sales and an increase in listings.
Average Days on Market (DOM) in January increased across the border as reduced demand in the last few months led to a rise in inventory and a change in consumer buying behavior. El Paso’s DOM remained around 50 days, while Laredo’s DOM moved down to 37 days. New listings in Brownsville and McAllen took more than two months to complete the sale.
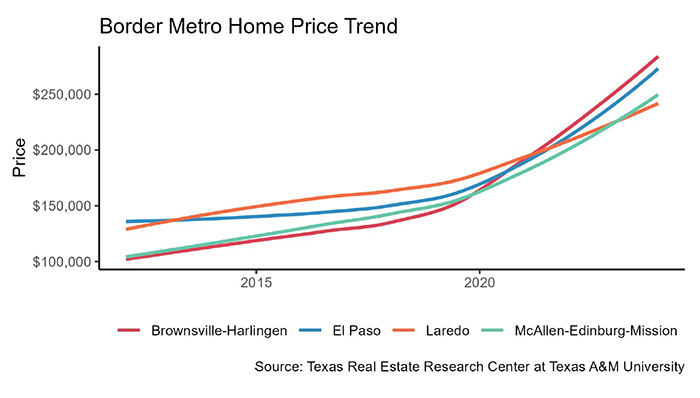
Reduced demand dented seasonally adjusted median home prices sharply across border regions in January (Table 4). The border region’s housing market is known for its affordability, a factor that has attracted many buyers from other areas.

1 Mexican manufacturing and maquiladora employment are generated by the Instituto Nacional de Estadística y Geografía. Its release typically lags the Texas Border Economy by one month.
2 The real peso per dollar exchange rate is inflation adjusted using the Texas Trade-Weighted Value of the Dollar.